About Monkey 2 › Forums › Monkey 2 Development › Should a mojo3d app be hogging 100% CPU?
This topic contains 14 replies, has 2 voices, and was last updated by ![]() DruggedBunny
DruggedBunny 1 year, 3 months ago.
-
AuthorPosts
-
January 1, 2018 at 8:39 pm #12556
I’ve only just noticed that mojo3d apps use 100% of the CPU they’re running on (16% of 6 CPUs here), while mojo 2D apps don’t. Is that intentional?
Quick copy-and-paste test below, but does same with mojo3d/tests/cubes.monkey2, for example:
Monkey123456789101112131415161718192021222324252627282930313233343536373839404142434445464748495051525354555657585960616263646566676869707172737475767778798081828384858687888990919293949596979899100101102103104105106107108109110111112113114115116117118119120121122123124125126127128129130131132133134135136137138139140141142143144145#Import "<std>"#Import "<mojo3d>"Using std..Using mojo..Using mojo3d..' ----------------------------------------' Application name...' ----------------------------------------Global AppName:String = "My 3D Game"Class Game Extends WindowConst SHIFT_BOOST:Float = 5.0Field camera_boost:Float = 1.0' Basic 3D scene requirements...Field scene:SceneField camera:CameraField light:Light' Test cube...Field cube:ModelField cubemesh:MeshField cubematerial:MaterialMethod New (title:String, width:Int, height:Int, flags:WindowFlags)Super.New (title, width, height, flags)scene = Scene.GetCurrent () ' Important!camera = New Camera' Camera settings...camera.Near = 0.1' Camera position...camera.Move (0, 0, -2)camera.Rotate (0, 0, 0)light = New Lightlight.Move (-10, 10, -10)light.Rotate (0, 0, 0)cubemesh = Mesh.CreateBox (New Boxf (-0.5, -0.5, -0.5, 0.5, 0.5, 0.5)) ' 1 x 1 x 1cubematerial = New PbrMaterial (Color.Aluminum)cube = New Model (cubemesh, cubematerial)cube.Rotate (0, 45, 0)EndMethod UpdateGame:Void ()EndMethod OnRender (canvas:Canvas) OverrideProcessInput ()UpdateGame ()cube.Rotate (0.0, 1.0, 0.0)cube.Move (0.0, 0.0, 0.1)' Tell app to draw frame when ready...RequestRender ()' Render scene to canvas (passed to OnRender by mojo), from camera...scene.Render (canvas, camera)EndMethod ProcessInput:Void ()If Keyboard.KeyHit (Key.Space) Then light.CastsShadow = Not light.CastsShadowIf Keyboard.KeyDown (Key.LeftShift)camera_boost = SHIFT_BOOSTElsecamera_boost = 1.0EndifIf Keyboard.KeyHit (Key.Escape) Then App.Terminate ()If Keyboard.KeyDown (Key.A)camera.Move (0.0, 0.0, 0.1 * camera_boost)EndifIf Keyboard.KeyDown (Key.Z)camera.Move (0.0, 0.0, -0.1 * camera_boost)EndifIf Keyboard.KeyDown (Key.Left)camera.Rotate (0.0, 1.0, 0.0)EndifIf Keyboard.KeyDown (Key.Right)camera.Rotate (0.0, -1.0, 0.0)EndifIf Keyboard.KeyDown (Key.Up)camera.Rotate (1.0, 0.0, 0.0, True)EndifIf Keyboard.KeyDown (Key.Down)camera.Rotate (-1.0, 0.0, 0.0, true)EndifEndEndFunction Main ()' Windowed mode...Local width:Int = 640Local height:Int = 480Local flags:WindowFlags = WindowFlags.Center' Full-screen mode (comment out above)...' Local width:Int = 1920' Local height:Int = 1080' Local flags:WindowFlags = WindowFlags.FullscreenNew AppInstanceNew Game (AppName, width, height, flags)App.Run ()EndJanuary 2, 2018 at 8:07 pm #12574This is a weird one.
It seems to be caused by using ‘real’ opengl drivers, eg: sticking this at the top of ‘Main’ in any mojo app should cause the problem too (tried: PromptInvasion):
Monkey12SetConfig( "MOJO_OPENGL_PROFILE","compatibility" )The top answer here seems to suggest it may just be a problem with how windows measures cpu usage and how opengl drivers work:
https://stackoverflow.com/questions/5829881/avoid-waiting-on-swapbuffers
SwapBuffers is not busy waiting, it just blocks your thread in the driver context, which makes Windows calculating the CPU usage wrongly: Windows calculates the CPU usage by determining how much CPU time the idle process gets + how much time programs don’t spend in driver context.
I’m a bit out of my depth here, but I read this as saying windows doesn’t count time spent in ‘driver context’ (some kind of privileged mode used by drivers where they can poke HW regs etc I assume) when calculating cpu usage, even if the app is blocked and ‘switchable’ while in driver context (so not really busy).
I did try Sleep( 0 ) and Sleep( 1 ) after SwapBuffers as suggested above. Sleep( 0 ) had no effect, but Sleep( 1 ) did appear to fix the cpu usage issue – however, it also seemed to disable all user input for reasons I can’t begin to imagine.
I’m going to leave this for now – if anyonle wants to look into it further please do and let me know how you get along, but IMO it appears the above post is correct and that the driver is in fact blocked and NOT consuming all that CPU (thanks to Sleep(1) test), it’s just that Windows can’t measure it.
January 2, 2018 at 8:25 pm #12575Actually, after a bit more research I’m not convinvced this is a non-issue – I installed a HWMonitor which definitely measures high power usage when opengl drivers are used vs direct3d. Will keep investigating but it may just come down to crappy drivers. You can always force d3d drivers on windows using:
Monkey12SetConfig( "MOJO_OPENGL_PROFILE","es" )But app will run a little slower in some instances.
Also, it appears that using ‘timer’ timing and SwapInterval 0 also fixes it…
Sleep( 1 ) ‘worked’ here the first time I tried it because Sleep sleeps for *seconds*, so yes, cpu usage went down!
January 2, 2018 at 9:11 pm #12578Posted a report in the nvidia developer forums so we now have top people working on it – TOP PEOPLE!
January 3, 2018 at 3:31 am #12583Top people? The best? Good work, Trump!
I’ll try play with this a bit tomorrow night, including the Angle thing — pretty sure my CPU fans go all-out, though who knows if that’s just because Windows thinks it’s using 100%?
January 3, 2018 at 7:04 pm #12611Just confirming the SetConfig/D3D workaround gives 0-1% CPU usage here.
Just saw your Sleep () edit! Ha ha, would explain the lack of input…
January 3, 2018 at 9:48 pm #12612Just confirming the SetConfig/D3D workaround gives 0-1% CPU usage here.
Yeah, but you’ll loose some performance, particularly with instancing.
Having another poke around at this now. Was unable to test on bmx as SetGraphicsDriver GLGraphicsDriver() now just crashes, but in monkey1 I can run bouncyaliens for glw3 target (ie: no angle) with SetSwapInterval 1/SetUpdateRate 0 and it doesn’t seem to hog CPU. Can you verify?
And what GPU do you have? driver version?
I’m on Geforce GTX 970 + driver v388.31
[edit]
In fact, I can run mx2 sdltest with opengl in compatibility mode without cpu problems…wonder if it’s something to do with my new opengl wrapper?
January 3, 2018 at 11:36 pm #12619In mx1 with bouncyaliens, it runs with minimal CPU as both…
Monkey123SetSwapInterval 0SetUpdateRate 60… and…
Monkey123SetSwapInterval 1SetUpdateRate 0… on plain glfw3.
But yeah, it’s mojo3d only, mojo 2d apps are absolutely fine.
sdl2test is fine too. That defaults to:
Monkey12SDL_GL_SetAttribute( SDL_GL_CONTEXT_PROFILE_MASK,SDL_GL_CONTEXT_PROFILE_ES )… and it’s still fine with:
Monkey1SDL_GL_SetAttribute( SDL_GL_CONTEXT_PROFILE_MASK,SDL_GL_CONTEXT_PROFILE_COMPATIBILITY )The problem does appear to be mojo3d-specific, as I say, 2D stuff doesn’t hog processor.
I’m on Nvidia GTX1060 6GB (specific model is “EVGA NVIDIA GeForce GTX 1060 Superclocked Gaming 6 GB”), using driver 388.31 also. Think that’s quite recent, but I’ll go update that and report back…
January 4, 2018 at 12:48 am #12622EDIT: See previous post too, as I know you often see only latest post!
Yeah, testing mojo3d/tests/cubes.monkey2 with latest public 388.71 drivers is still the same. (I deleted the build/products folders, just in case.)
So, with no compatibility tweaks…
mojo3d
100% CPU
2d (bananas/mojotest/mojotest.monkey2)
0-1%
What’s interesting now (by which I mean worse) is that…
Monkey12SetConfig( "MOJO_OPENGL_PROFILE","es" )… doesn’t appear to fix mojo3d cubes test any more — it’s now hogging CPU with that in place, all build/products deleted/rebuilt.
The code in my first post, with “es”/Angle enabled, still runs at 0-1%, while without “es” it’s still hogging 100%.
I’ve checked via Process Explorer and with “es” compatibility it is loading the d3d DLLs, while without it’s only using opengl DLLs, so cubes appears to be hogging in D3D too on latest drivers.
Definitely mojo3d only, but seems to be affected by/caused by drivers as you suggested.
I’ve just tried an old openb3d test in Brucey’s bmx-ng, and that actually runs with 0-1% CPU, no Angle involved. Not sure of the ins and outs of its setup, but it’s certainly an OpenGL/shader-based engine. (I could always upload a standalone install that ‘should’ work if you wanted to compare, but it’s like 800+ MB, 7-zipped with the mingw version it runs on.)
Slightly OT: I ran the driver update with Ted2Go open and it crashed — I assume mojo needs to check for this case, ie. suspend when driver disappears/reappears, which I vaguely recall one of the Max/Monkey ‘commercial’ developers said was possible (and possibly had you fix), on modern Windows at least. Let me know if I should report as ‘issue’, not sure if it is actually avoidable.
January 4, 2018 at 12:57 am #12623The problem does appear to be mojo3d-specific, as I say, 2D stuff doesn’t hog processor.
It does here, you need to set MOJO_OPENGL_PROFILE to “compatibility” for it to happen though. mojo 2d defaults to es profile.
Think I’ve found it anyway – there are a bunch of ‘forbidden’ ops that seem to cause bad things to happen, just fixing now.
January 4, 2018 at 3:00 am #12626Fixes up now in develop branch!
January 4, 2018 at 3:04 am #12627Just building, will post before hitting the hay!
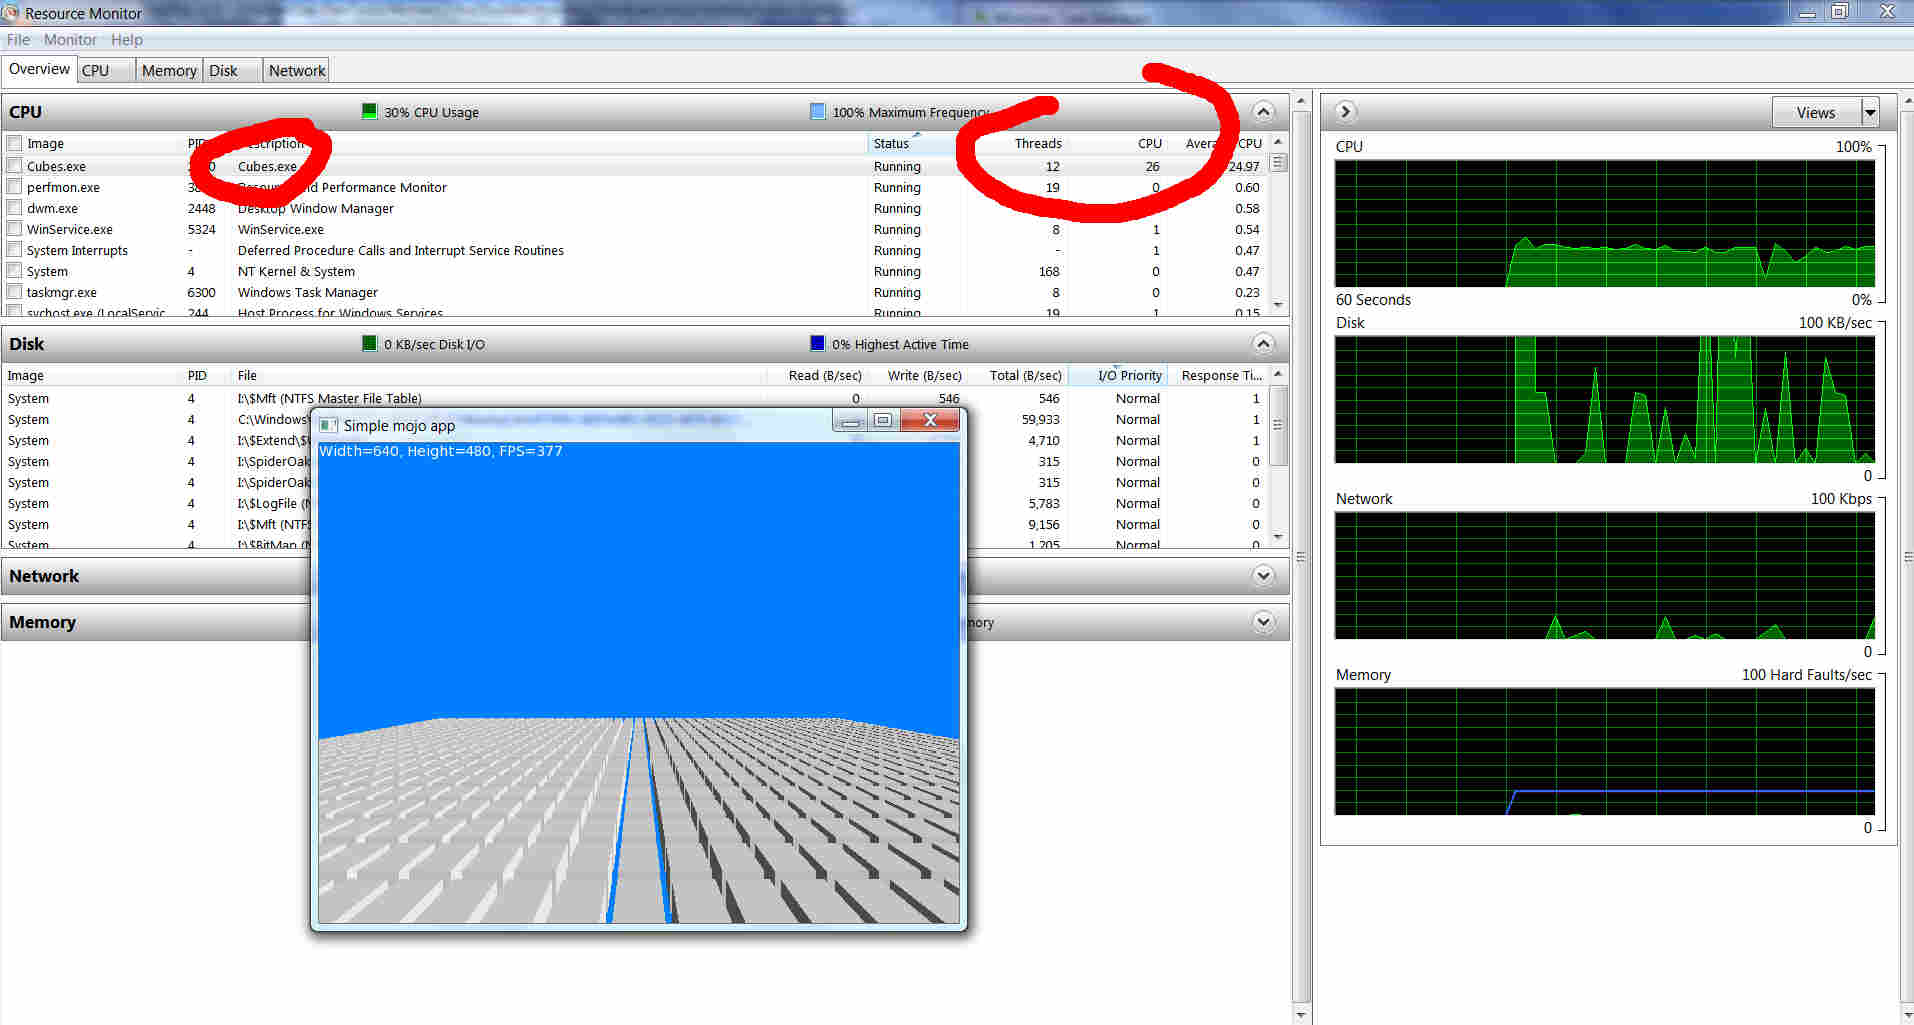
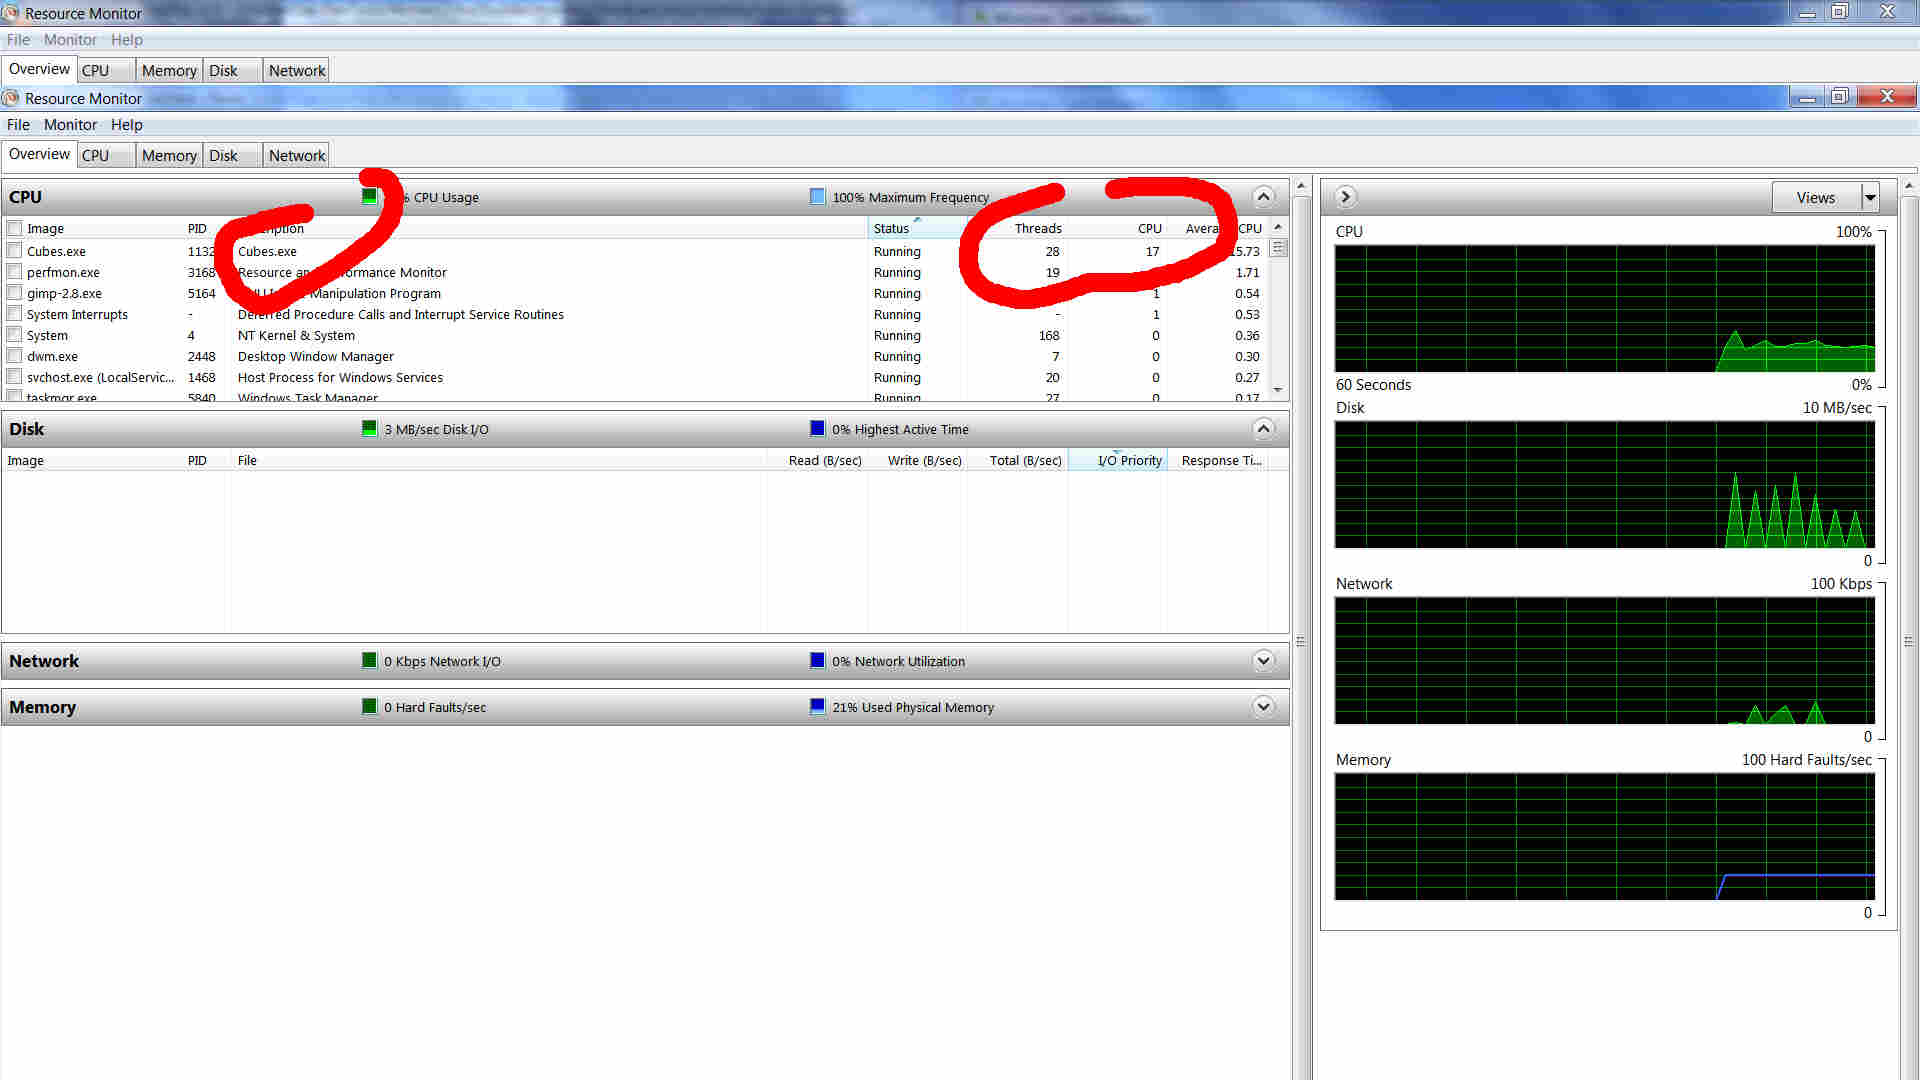
January 4, 2018 at 3:35 am #12628Being the bearer of bad news, I apologise… but cubes shows higher CPU here (actually more than 1 CPU, somehow, average about 26%, seen 28%), while the code at the top shows almost 0!
It was typically 16-17% before, which at least makes sense for full 1 x CPU usage. Perhaps it’s now somehow using another couple of threads?
EDIT: Er, it’s using way less threads, but more CPU… see attachments!
Both are in Release mode.
Perhaps cubes is doing heavy stuff in main loop, though it doesn’t look like it (not checked code, gotta go to bed for work!).
The changes obviously do something really weird with threads…
Just re-run both current and last develops to check again, definitely per screenshots, ie. old has 16-17% (1 x CPU) and new has 26-27% (2-3 CPUs), with old having ~twice as many threads! Both in Release.
January 4, 2018 at 8:16 am #12632Going by the FPS in your screenshot, it looks like you have SwapInterval set to 0, in which case cpu usage *should* be very high as there is no syncing going on – the app is just drawing as fast as it can, and frames will be thrown away if you’re drawing them faster than the monitor can display. It’s like a repeat/forever loop with nothing in it – cpu usage in this case will hit 100% for a core too.
It’s only when an app ‘blocks’, ie: goes to sleep waiting for something to happen, that cpu usage goes down. This is what SwapInterval=1 achieves – when buffers are swapped, cpu goes to sleep while waiting for vertical blank. With SwapInterval=0, cpu never goes to sleep, ie: 100% usage.
By using >1 core, the nvidia driver is actually being really clever. It’s using some serious theading in order to draw as much stuff as it can because it assumes this is what you want. It doesn’t know you’re not doing some fancy preprocessing or whatever, so it just renderers as fast as it can.
But the new version should be forcing SwapInterval to 1 by default anyway so something’s up there – maybe you have it ‘forced’ to 0 in nvidia control panel? Make sure the ‘vertical sync’ option in nvidia control panel is set to ‘Use the 3D Application’ setting.
Anyway, think we’ve been chasing different ‘issues’ here a bit! My problem was that even with SwapInterval=1 (ie: 60FPS), all 3d stuff was still taking 100% of 1 core and that at least appears to be fixed so I’m happy anyway.
And bah, I only get 93FPS with cubes and SwapInterval=0, 377FPS is very impressive!
January 4, 2018 at 11:18 pm #12653OK… that looks to be it — with SwapInterval=1, cubes runs at around 4-5% total CPU now (that would be maybe 20% on a single CPU), obviously much better, though if nothing’s going on I’d have thought it’d be near zero. Maybe that’s mostly the driver stuff, though? [EDIT: It is… ]
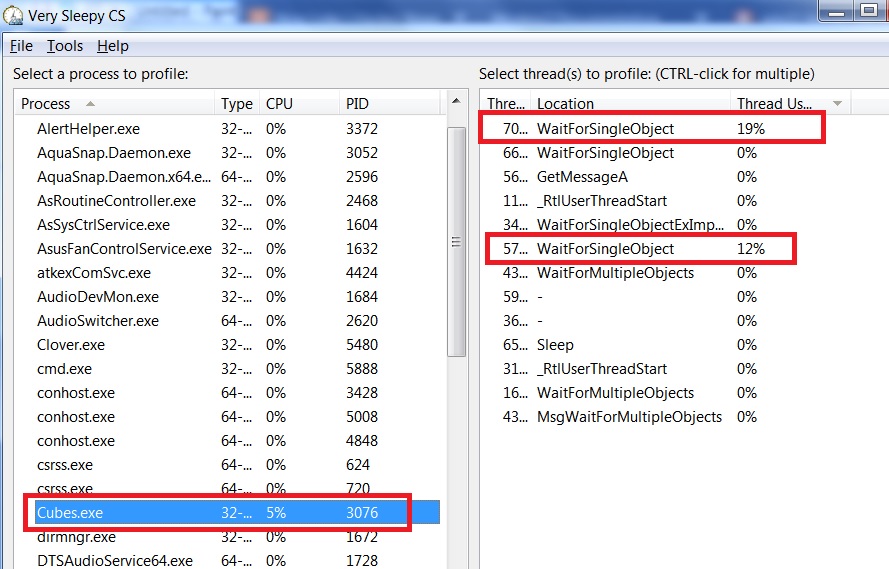
I did find a cool little profiler while trying to determine which thread was doing the most work:
It’s pretty cool — you highlight the process of interest, then either profile all threads, or the one(s) you’re interested in, leave it a few seconds and stop it, then you get a list of functions that are being called, and for how long (much better function list if you download the symbols first and run the game in debug mode).
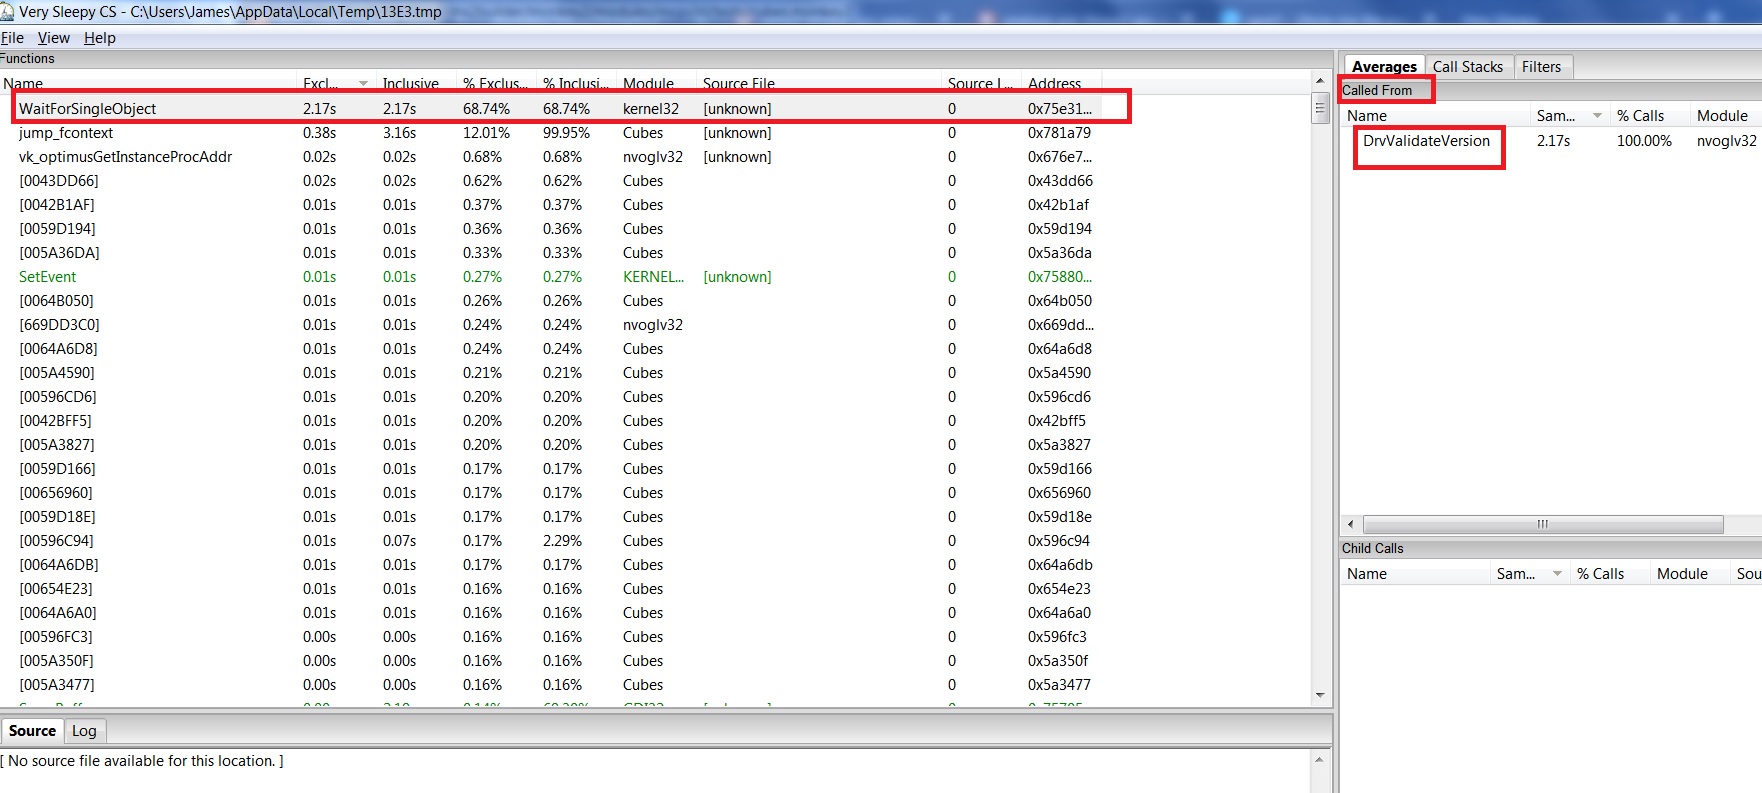
Kinda hard to make much practical sense of, but running in release mode, then just highlighting the cubes process and watching the thread usage is kind of interesting (see image vsleepy.jpg). It shows WaitForSingleObject as a key busy-function (right-hand pane), and if I profile that, I get vsleepy2.jpg, which seems to suggest DrvValidateVersion as the caller, and a quick Google says that’s part of the driver.
I checked the only other high-usage thread showing in vsleepy.jpg — everything else being basically 0% — and that’s also driver-related (DrvPresentBuffers and DrvValidateVersion), so it seems all of that CPU usage is down to Nvidia.
Anyway, that has basically solved it, way better than before, been running for a while now and fans are much quieter!
Well sorted!
Regarding the 1060, it’s a pretty good card for 1080p stuff, runs most things very well. Does 4k, but you have to turn most things down for that. Just saw on PCGamer that it’s currently the most-used graphics card on Steam!
Oh, I had vsync set to use app setting already… however, just tried commenting out SwapInterval=1 in cubes, and it does do the lower CPU usage, so sounds like that’s actually working! Which doesn’t explain last night’s results/screenshots… er… ?
Treat as resolved for now!
Attachments:
-
AuthorPosts
You must be logged in to reply to this topic.