Here’s another shot
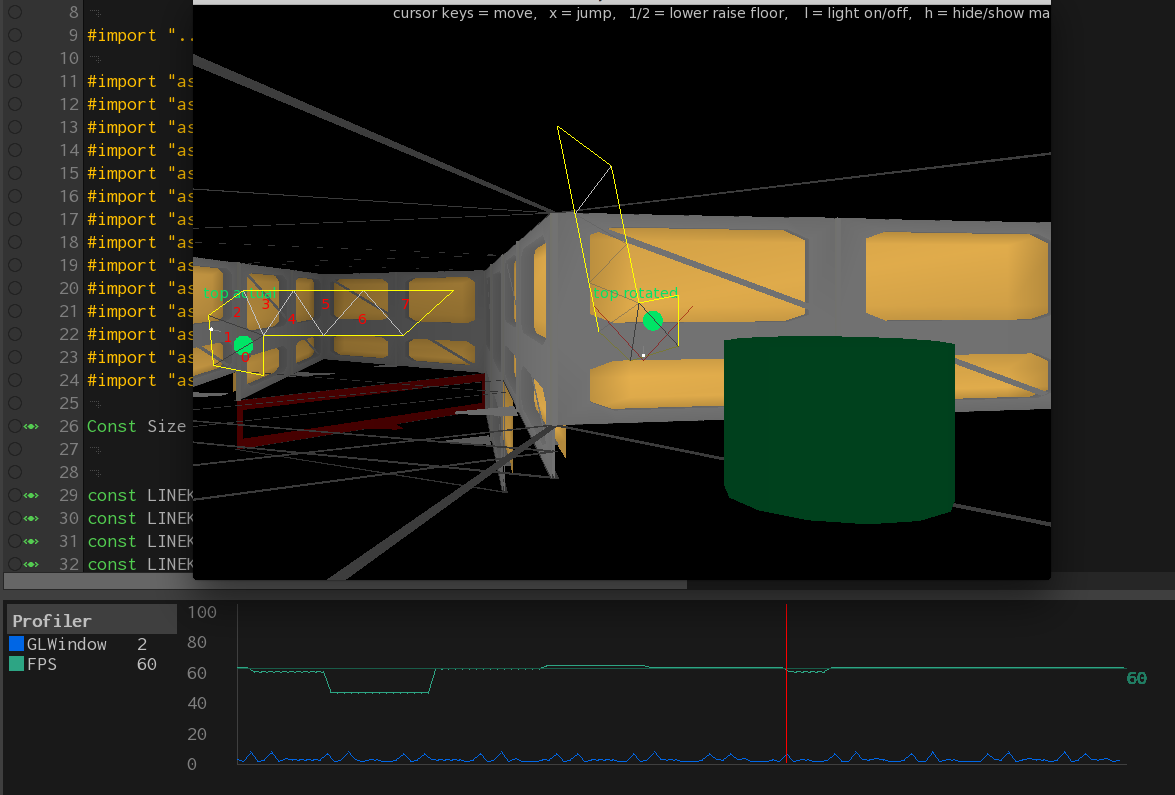
This time showing something more like real world usage: profiling my doom investigations and 3d performance.
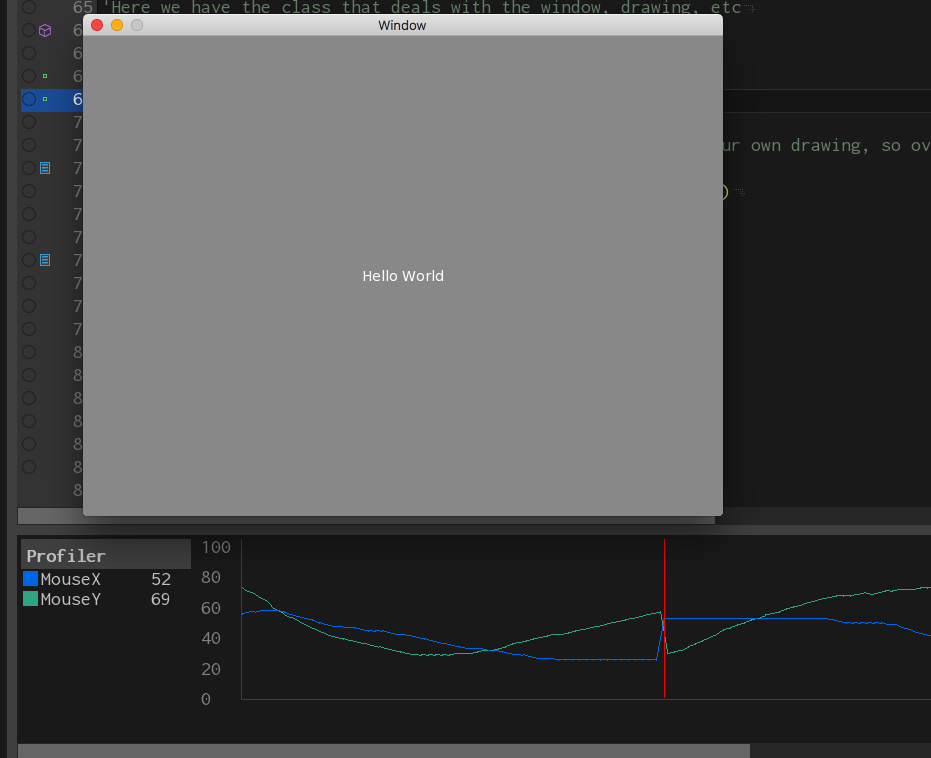
there are two profile variables being used. one watching the FPS and one the millisecs taken by the GL rendering.
This is in debug mode and you can see there is a double spike in the gl (sort of like a heartbeat) every few 100 milliseconds or so.
You can also see the fps sits ate just above or below 60. I’ve added marker lines at 60 so you can see the deviation.
the sudden drop in fps was when I moved off the window to activate the screen capture.